Rendering High Resolution Maps in Kartograph
 This is going to be a quick run-through the creation of the latest Kartograph showcase which is a high res vector map.
Select your map projection
I really like the idea of starting the map creation process with choosing a map projection. As mentioned in my last post, the projection can be seen as a very crucial point of every map. It allows you to define the perspective on the geography. In this showcased I used the tilted perspective projection, looking from Florida to New York. 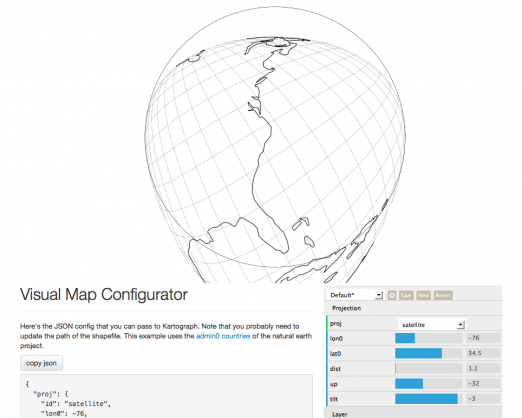 The new visual map configurator shown in the above picture not only gives you a preview of how your map will look like, but it will also give you a nice template for the JSON configuration Kartograph will use to generate the map. The next step is to tell Kartograph were to cut the map view. This time I will use the points mode which allows me to give Kartograph a set of coordinates that I definitely want to be included in the map. You can add some padding, too.
    "bounds": {
      "mode": "points",
      "data": [[-70.5,41.2],[-90.1,32.1], [-72.8, 34], [-70.8, 31.5]],
      "padding": 0.02  // defined as ratio of total width
    }
Since this feature is not included in the visual configurator (yet?) it’s up to you to experiment with some coordinates to find out I nice bounding box. Finally I ended up with something like this: 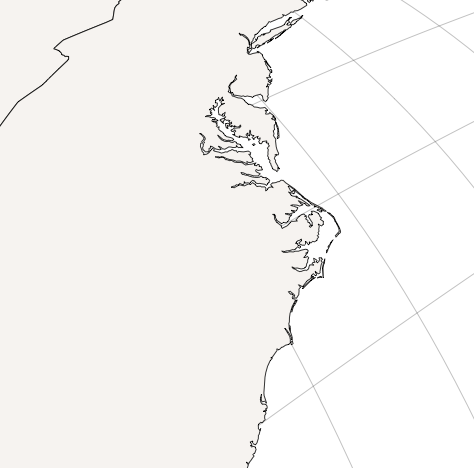
Define outer Latitude/Longitude range
Since our map only shows a small part of the world, we can speed up the map creation process by forcing Kartograph to skip every geographic feature that lies outside a given lat/lon bounding box. To select the bounding box I used the nice OpenStreetMap export feature.
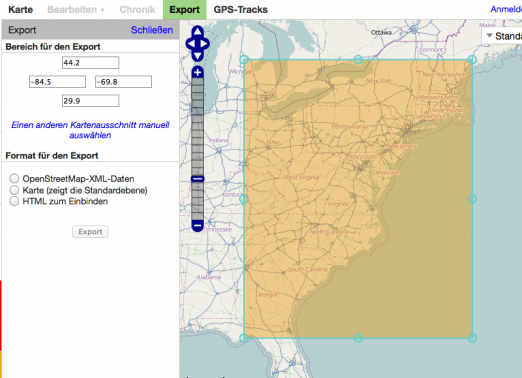
The limits for latitudes and longitudes are then added in the bounds.crop property. The format is [minLon, minLat, maxLon, maxLat]:
"bounds": {
"mode": "points",
"data": [[-70.5,41.2],[-90.1,32.1], [-72.8, 34], [-70.8, 31.5]],
"padding": 0.02
"crop": [-90.85, 28.12, -65.69, 51.9]
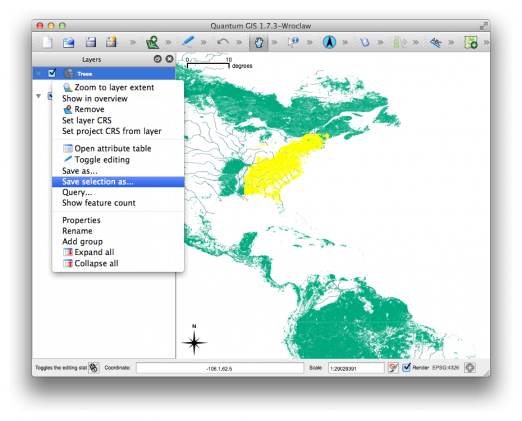
}Of course, to find out which feature lies inside or outside the selected bounding box, Kartograph still needs to run through all the features in the shapefiles. If you deal with really huge shapefiles (like this 100mb shapefile containing 167.000 forest polygons) a better idea would be to filter the data directly in the shapefile. The open source GIS software QuantumGIS makes this really easy:
 Add some nice layers
At this point all what’s left to do is to select a nice set of layers that you want to include in your map. I ended up with like ten layers coming from Natural Earth and VMAP. You can give the layers some basic styling to make it easier to work with the raw map output in Illustrator.
    "layers": [{
      "id": "trees",
      "src": "shp/custom/useast/trees.shp",
      "styles": {
        "fill": "#b1bfb1",
        "fill-opacity": 0.4,
        "stroke": "none"
    }]
Here’s how the map configuration finally looked like.
Refine in Illustrator
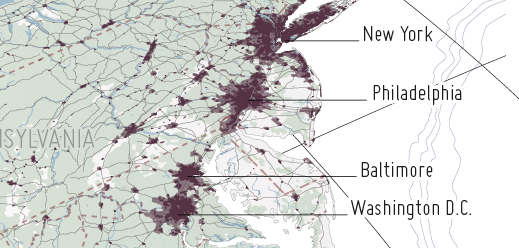
After finishing the map configuration I loaded the generated SVG (7 megabytes) into Illustrator to add some labels and refine the colors. 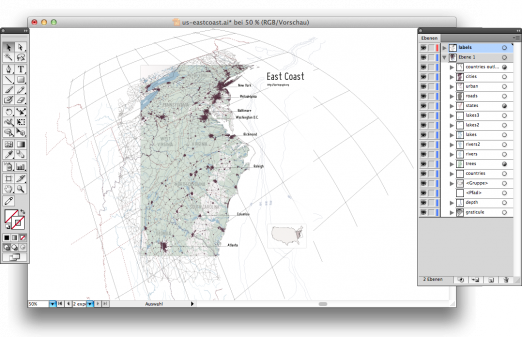 And here’s the final result:
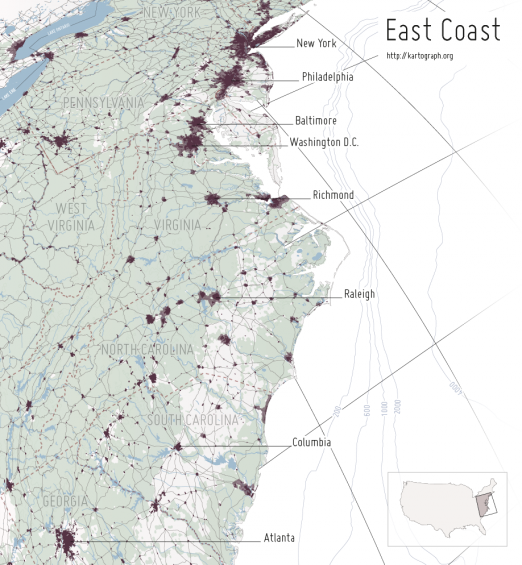
Related links
Comments
Alkxzo (Apr 03, 2012)
I’ve never used anything like Kartograph before but I was curious and gave it a try. Managed to do this just now: http://i.imgur.com/6Ag4s.png Not much, but it was very easy to use, it’s great.
Gregor Aisch (Apr 03, 2012)
That’s more than great to hear. On what system did you managed to install Kartograph?
Alkxzo (Apr 03, 2012)
On Arch Linux, doing the automatic install.
Ferdinand (Apr 04, 2012)
Still quite lost in the map world. However your blog has been a great resource. Great work! Thanks!
Christian Ledermann (Jul 30, 2012)
Thank you for this detailed tutorial
Jesus Arocho (Nov 27, 2012)
Hello,
Just started to use kartograph to support my geography class creating maps for student homework, practice, and exams. Great tool although it is taking me a while to learn the code.
Where can I find the visual map configurator tool?
Thanks