Experimenting With Stream Graph Colors
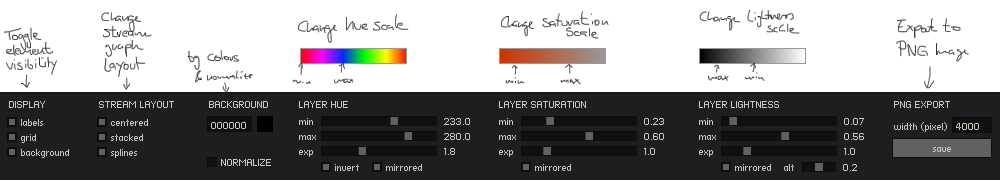
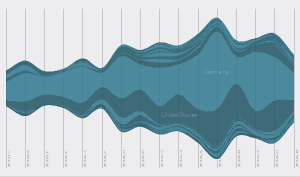
I’m not quite sure about the real practical use of stream graph visualizations, but I admit that they look very nice. In the last week I experimented a little with stream graphs and created a tool which helps finding nice color scales for stream graphs. It allows to define three different scales for each component of the HSL color space. The displayed data set is taken from Piwik Analytics and shows the evolution of visitor countries over the last 16 weeks. Click on the image to enter the live version. 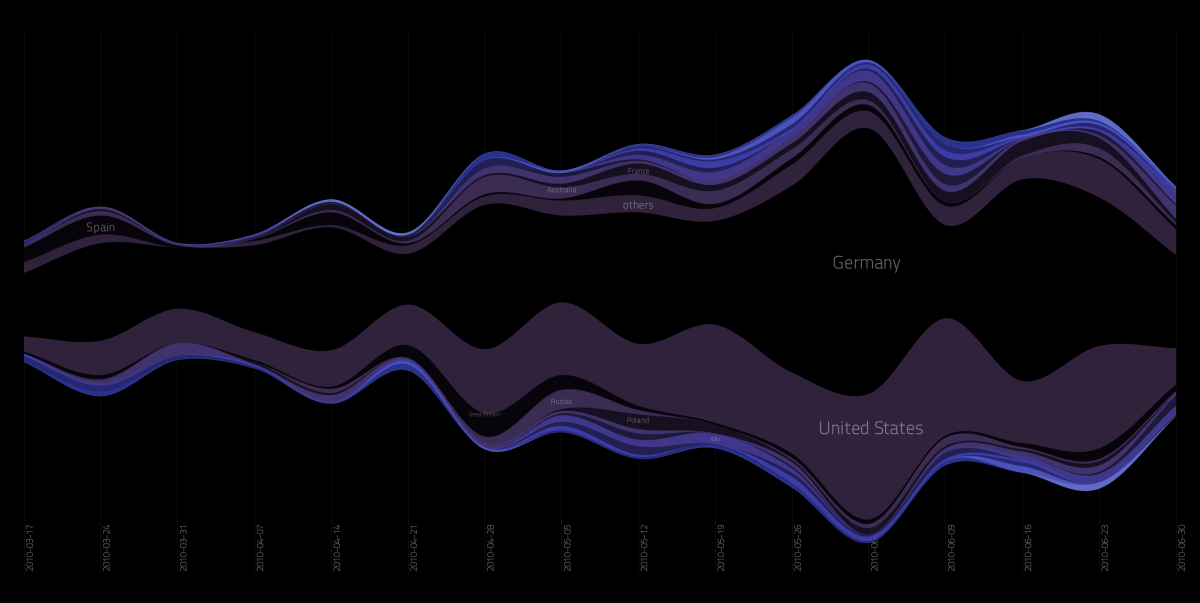 Below you find a small introduction to the different toolbar controls.
Update: I added the possibility to copy the URL of the current settings, which allows to permamently store and share a color scale.
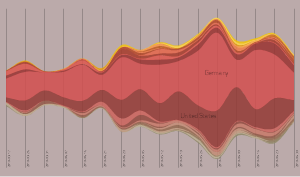
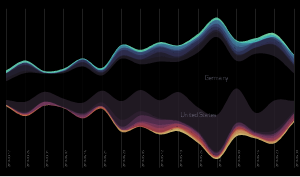
Here are a few quick examples for different settings:
Comments
Wolf (Sep 23, 2010)
Superschick Gregor. Sag mal, hättest Du nicht Lust mal was am Webmontag zum Thema Datenvisualisierung zu machen?