Improving WordPress Stats Charts (1/2)
 Wordpress.com Stats is the most used statistic plugin for wordpress (with over 1.5 mio downloads so far). It offers a very simple way of collecting anonymous visit statistics and has a nice backend that lets you explore the data using line charts and tables. I keep using this plugin since the very beginning of this blog and I must admit that I’m looking at it every day. But in doing so I recently started getting bugged of the charts. This post series shows ten ways for improving them. Hint: if you want to skip all the boring talk about charts, you can jump directly to the live-demo of the improved wordpress.com stats chart.
Improving The Daily Visits Chart
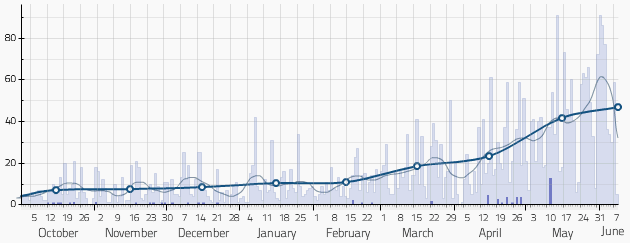
Here is the original line chart that shows the total number of daily visits: 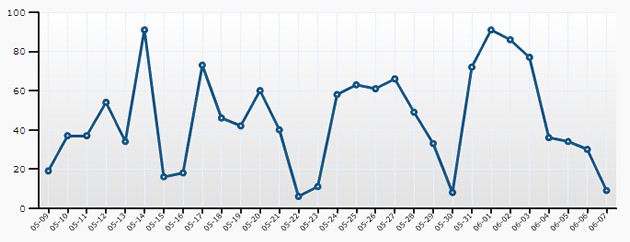
1. Chosing The Right Chart For The Right Data
Originally, the daily visits are visualized in a line chart. Line charts are good and commonly used to show trends in data over continuous time series. But in the case of our daily visit chart we have a non-continuous time axis. If there were 100 visits on monday and 50 visits on tuesday, we cannot expect 75 visits in the night between monday and tuesday, but this is exactly what the line chart shows us. In cases of discontinuous (or discrete) data, a simple bar chart is the better choice. 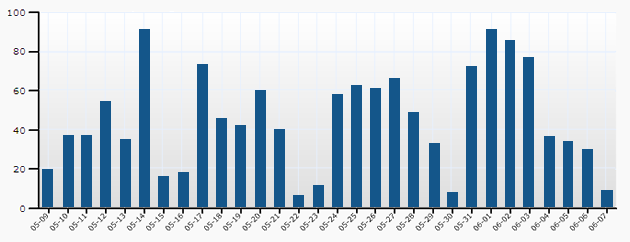
2. Showing Indicators For Weekends
Obviously, the number of daily visits follows certain patterns every week. Since there are less people surfing the web on weekends, the number decreases each saturday and sunday. This pattern has a greater influence on the visit number than any of my posts, so it makes sense to introduce an indicator for weekends. In the following example, I changed the bar colors for saturdays and sundays. 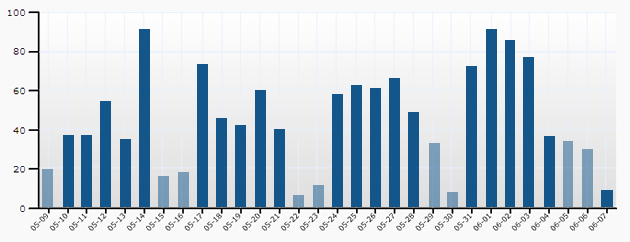
3. Enhancing The Contrast Between Background And Grid
A gradient background from gray to white might be a crucial feature to someone, but for most people this just causes that one cannot perceive the grid. In the next version I changed the color of the background and the grid, which makes the grid a lot more useful. 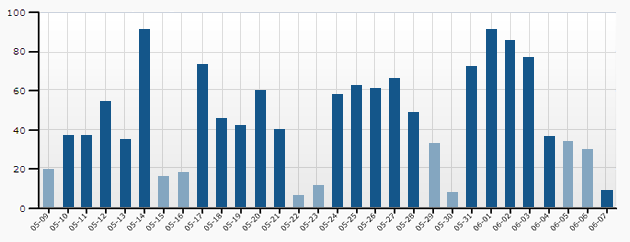
Improving The Weekly Visits Chart
Now we start looking at the chart for the weekly visits. Again, this is the original line chart that is showed in the wordpress stats plugin. 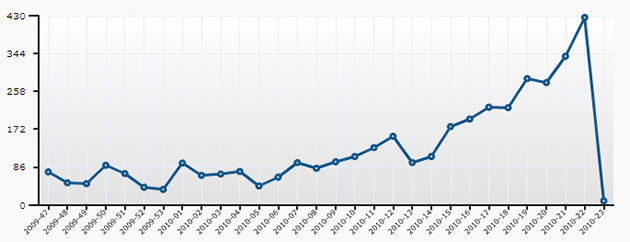
4. Introducing A More Usable Labeling Of The Time Axis
The time axis is labeled with the week numbers. If you have no calendar next to you, I bet that you don’t know the exact date of the 14th week of 2010, even guessing the right month is difficult. In the next version I labeled the weeks with the date of the first day of the week and put the name of the month below. 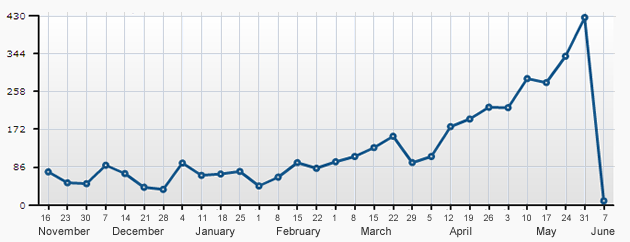
5. Using Rounded Values For The Visit Axis
As you can see in the above image, the chart for the weekly visits introduces labels like “344” or “258”. This might be a little more comfortable for the developer, but it makes the chart less readable. Instead, rounded values like 300 and 400 are more easy to remember and help the viewer interpreting the chart. 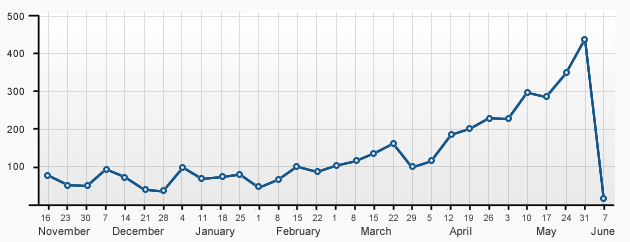 In the next part I’ll continue with five more improvements like dealing with different month lengths or adding contextual information to the charts. Do you have any remarks so far? Feel free to post them in the comment section below.
Comments
Improving WordPress Stats Charts (2/2) | vis4.net (Sep 16, 2010)
[…] the last part I gave five improvements to the charts that are shown in the WordPress.com Stats plugin. I ended […]