Tutorial: Using the Bubble Tree for Display of Random Data
Recently I finished the work on the interactive Bubble Tree for the OpenSpending project. This tutorial demonstrates how to use the visualization for display of your own data. Here’s the link to the resulting visualization.
Setting up the page
You need to checkout the Github repository or download the source files to go through this tutorial yourself. At first we’re going to create the container HTML page.
Now the BubbleTree would load and try to display what’s inside the data, which we will build in the next step.
Building the random data
The next thing we do is to prepare a random data set. The BubbleTree uses a very simple nested tree structure. The nodes must follow the following format:
var data = {
	label: 'I am a node',
	amount: 123456789
};
We could now run the visualization and would get the following result: 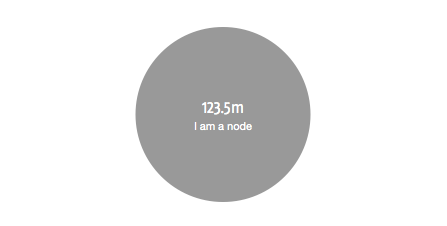 We can insert child nodes by putting them into the children Array:
var data = {
label: 'I am a node',
amount: 1000000,
children: [
{
label: 'I am the 1st child',
amount: 400000
},
{
label: 'I am the 2nd child',
amount: 600000
}
]
};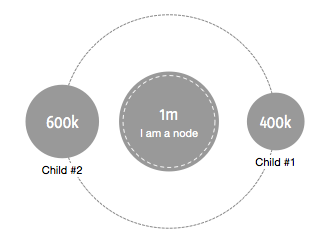 Instead of inserting all the children by hand, we will use a function to generate a random set of children for a given node.
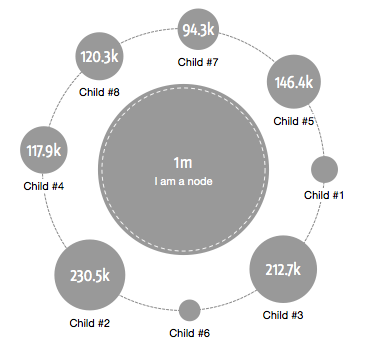
function generateChildren(node) {
	var numChildren = 8;
	node.children = [];
	var amount = node.amount;
	for (var i=0; i
Et voila, the result looks like this:
Adding some color to the nodes
This is the perfect time to setup some styling for the nodes. I will use my little helper library vis4color to generate nice random HSL colors.
child.color = vis4color.fromHSL((i / numChildren) * 360, 0.7, 0.5).x;Generating children of children of children
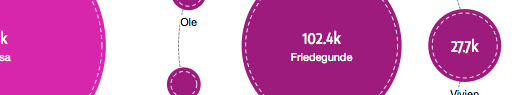
The last thing to do is to call our generateChildren recursively for each child node we generate. To know when to stop the recursion, we will also pass a new parameter level to the function. For a little extra fun, I added an Array randomNames which contains a set of randomly chosen forenames. I will use this array to add random labels to the nodes.
var randomNames = ['Burgis', 'Pascal', 'Lysann', 'Theo', ...];
function generateChildren(node, level) {
if (!level) level = 1;
var numChildren = 8;
node.children = [];
var amount = node.amount;
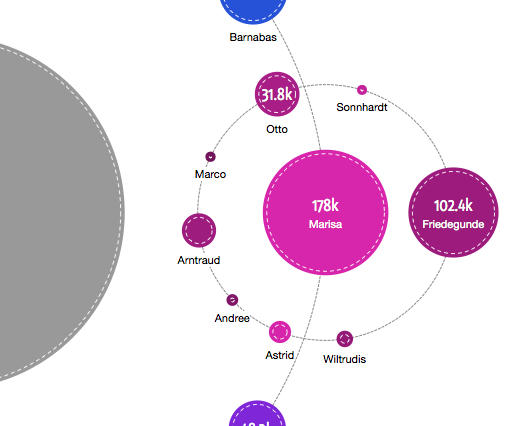
for (var i=0; iHere is our final output. Click on the image to get to the interactive demo. You will find all the source files inside the demos/random/ folder in the Github repository.
Comments
Grace (Oct 16, 2011)
Hi, this is a great visualization project! We are planning to use this to visualize some government data. However as we need to ensure our website support Internet Explorer but looks to us this library has some issues with at least IE8, do you have any plan to make this library fully functional in IE? Many thanks!
zimmi (Mar 10, 2012)
Hi, I just wanted to give BubbleTree a try, but I got stuck right in the beginning. I use the second example from this tutorial at http://www.zimmi.cz/bubbletree/myIndex.html, but nothing ever loads. Opera Dragonfly says “TypeError: cannot convert ‘a’ to object at line 16. Where did i go wrong?
Gregor Aisch (Mar 10, 2012)
Actually I never tested in Opera. Will have a look..
Patrick Martin (Aug 04, 2012)
I love it. This would be a perfect alternative to cascading pie charts and treemaps, partition maps, starburst, sankey, etc… Things which are used to show inner components and give a sense of ratios.
It would be even more effective if there was a small panning window which kept your perspective on where you are within the whole set of relations (especially when you dig down deep).
I would like to incorporate this into my tool Dex sometime in the future if you were ok with it.
http://www.javainc.com/projects/dex/
- Pat