Mapping data to circles
A very simple rule in visualizations is to never map scalar data to circle radii. Humans do better in comparing relative areas, so if you want to map data to a shape, you have to map it to it’s area. The rule is that simple that normally it’s not worth a blog post. But as I’m currently reading the book ”[Visualizing Data](http://oreilly.com/catalog/9780596514556)” by Ben Fry I was very surprised to notice, that shown examples are continuously breaking this rule. The operative point in this case is data integrity, which means to tell the truth about the data you’re displaying. Showing all shapes in it’s true relative dimension is a fundamental law in data integrity.
A book about data visualization isn’t allowed to miss this rule. So, to fill this little post with some graphics, I made two simple illustrations. Both containing a set of circles that represents the data set [6.25, 12.5, 25, 50, 100, 200]. Each circle should look like as twice as large as the circle to its left. [caption id=“attachment_872” align=“aligncenter” width=“555” caption=“These values were mapped to the circle radii”]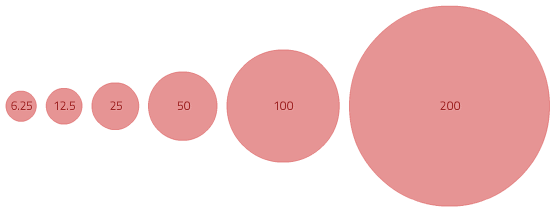 [/caption] As you see above, especially the step from 100 to 200 looks not like its only the double value. As this brings in a quadratic error, the bigger the values, the bigger is the error. The next illustration show the same data set with corrected circle radii: [caption id=“attachment_873” align=“aligncenter” width=“648” caption=“These values were mapped to the circle areas”]
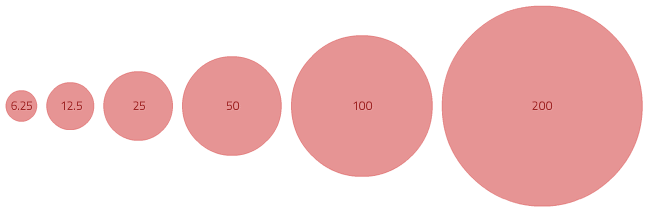 [/caption] To make It even more comfortable I’m going to publish this super exclusive actionscript snippet that helps you mapping data to a circle radii:
/**
 * @param v The value to map
 * @param dmin  Minimum value in data set
 * @param dmax  maximum value in data set
 * @param rmin  circle radius for minimum data value
 * @param rmax  circle radius for maximum data value
 */
function mapRadius(v: Number, dmin: Number, dmax: Number, rmin: Number, rmax: Number): Number {
	var areaMin: Number = rmin * rmin * Math.PI;
	var areaMax: Number = rmax * rmax * Math.PI;
	var area: Number = ((v - dmin) / (dmax - dmin)) * (areaMax - areaMin) + areaMin;
	return Math.sqrt(area / Math.PI);
}
Further reading:
- Linear vs. Quadratic Change by Robert Kosara